Quantcast
Channel: Jordansphere
Viewing all 229 articles
Browse latest View live

Convert NetApp Ports from FC to CNA

$
0
0

Problem

I wanted to convert two FC ports to CNA (10Gb eth) mode on a Netapp AFF-300. The ports in question are 0e and 0f. 

aff-300-1

Steps

The following will work for FAS units as well.

Display internfaces:

sannapp02::> ucadmin show


                       Current  Current    Pending  Pending    Admin
Node          Adapter  Mode     Type       Mode     Type       Status
————  ——-  ——-  ———  ——-  ———  ———–
sannapp02-01
              0e       fc       target     –        –          online
sannapp02-01
              0f       fc       target     –        –          online
annapp02-01
              0g       fc       target     –        –          online
sannapp02-01
              0h       fc       target     –        –          online
sannapp02-02
              0e       fc       target     –        –          online
sannapp02-02
              0f       fc       target     –        –          online
psannapp02-02
              0g       fc       target     –        –          online
psannapp02-02
              0h       fc       target     –        –          online
8 entries were displayed.


2) Disable relevant Interfaces on Node 2

network fcp adapter modify -node sannapp02-02 -adapter 0e -status-admin down
network fcp adapter modify -node sannapp02-02 -adapter 0f -status-admin down


3) Change Mode 

system node hardware unified-connect modify -node sannapp02-02 -adapter 0e -mode cna

You will get the following option:

Warning: Mode on adapter 0e and also adapter 0f will be changed to cna.
Do you want to continue? {y|n}: y

Any changes will take effect after rebooting the system. Use the "system node reboot" command to reboot.

3) Reboot Node 2

system node reboot -node sannapp02-02

4)  Enable interfaces on Node 2

network fcp adapter modify -node sannapp02-02 -adapter 0e -status-admin up
network fcp adapter modify -node sannapp02-02 -adapter 0f -status-admin up


Repeat the steps above with Node 1


Analytics Service Registration with Component Manager Failed

$
0
0

Scenario:

I attempted to migrate a vsphere 6.0 U3 environment to 6.7 U3. This included a VCenter (Win 2008), External PSC (Win 2008) and external MS SQL 2008 (Win 2008) to the  VCSA with external PSC appliances.


Issue

During the PSC imigration  the following error appeared – after the new appliance was deployed and old PSC turned off

Error: Analytics Service registration with Component Manager failed

Migrate_psc_fail1

Resolution

In the log files (analytics_firstboot.py_6604_stderr.log) I could see the following error:

2020-04-21T19:11:27.717Z  Failed to register Analytics Service with Component Manager: hostname 'jord-sso01.jord.local' doesn't match '192.168.65.8'

So the error appeared to be a reverse DNS entry on my NameServers – which I should have checked before upgrading. :-)

Upgrade NSX-T from 2.5.1 to 3.0

$
0
0

Upgrade NSX-T 2.5.1 to 3.0

Please find the step-by-step process for upgrading NSX-T 2.5.1 to 3.0 

1) Download NSX Cloud Upgrade Bundle for NSX-T 3.0.0 from Vmware.com website.

2)  Log into NSX-T Manager Node (DO NOT USE VIP)

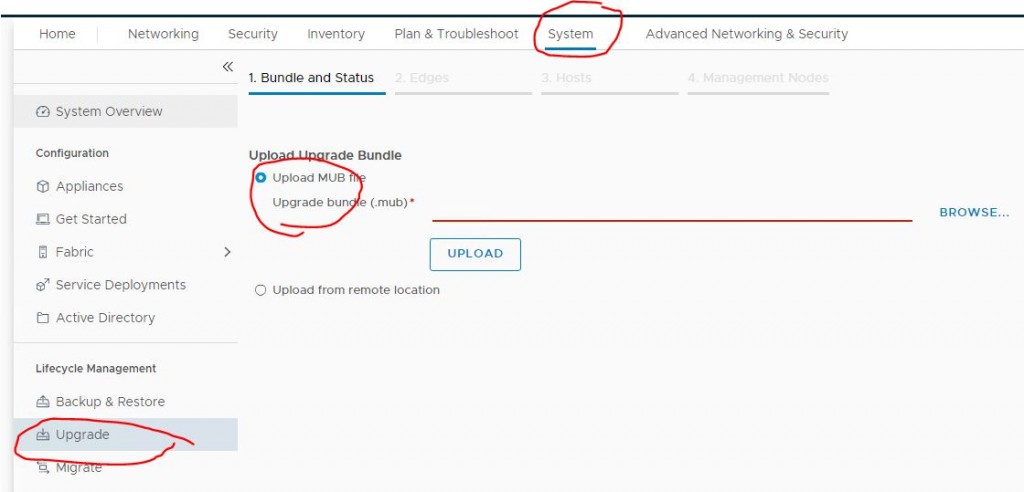
Go to System -> Upgrade -> Upload MUB file -> {Select file} -> Upload

nsxt-u1

This will upload the bundle, extract it and display a "BEGIN UPGRADE" if successful

2) When uploaded click Begin Upgrade  -. Continue -> Continue

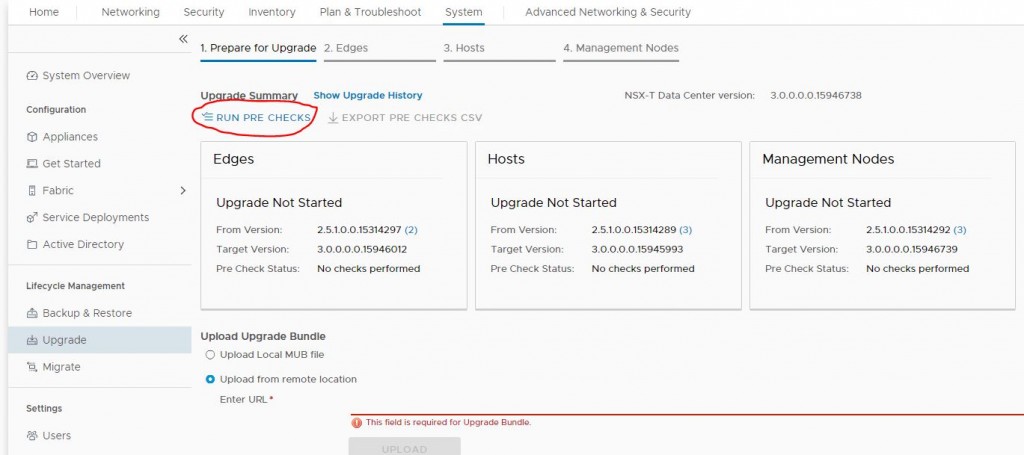
3) Select RUN PRE CHECKS

nsxt-u2

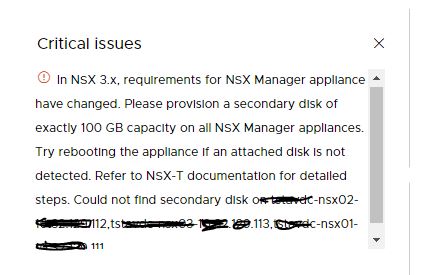
Note: This threw up an error about adding a 100GB to each NSX Manager Node

nsxt-u4


To do this log into the VCSA and on each NSX Manager Node -> Edit Settings -> Add New Device -> Hard Disk {w/ configuration of 100GB – thin provision)

Then back on to the upgrade page and click Run Pre-checks again.


The click Next -> Then Start on the Edges section

You will see the following page:

nsxt-u5

Note: I'd left this running and when i came back my browser had timed out but I was able to see that it had completed and was able to resume the upgrade.

nsxt-u6


On the hosts tab -> start

nsxt-u7

Note: Serial option will do one host after another by putting each in maintenance mode and install the new NSX-T VIBs

nsxt-u8

Once complete  you can then move onto the maangement nodes by pressing Next -> Start

You'll see a status during the upgrade.

nsxt-u8

Note: During the upgrade I was kicked out of the process with the following error on the NSX-T manager nodes:

Some appliance components are not functioning properly


nsxt-u10

Just give this several minutes and the node services will eventually restart.

Upon logging back it was still showing as "Upgrade In Progress"

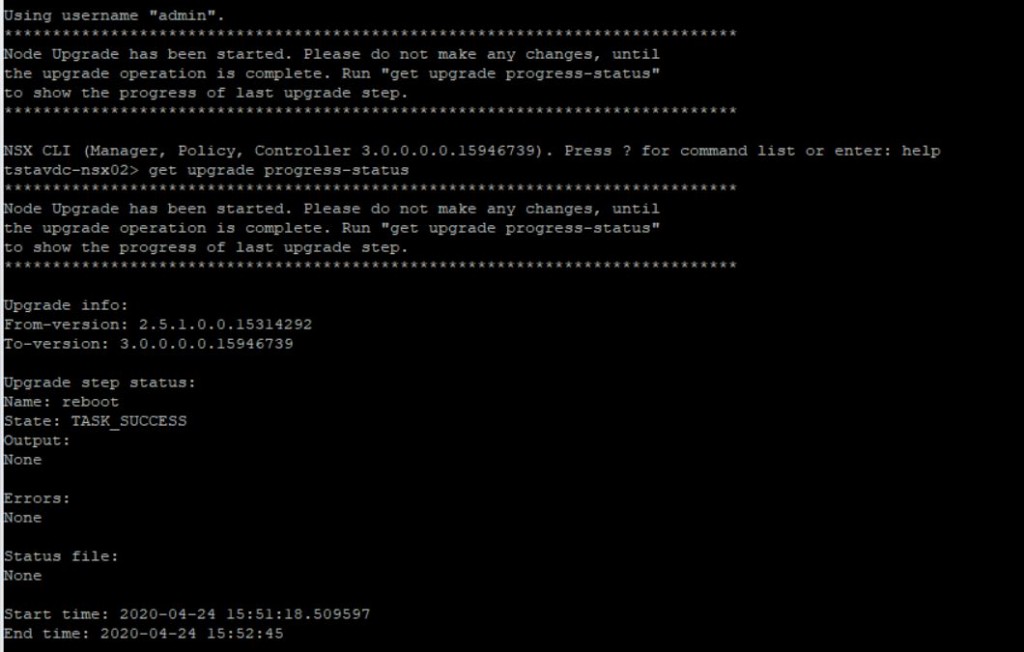
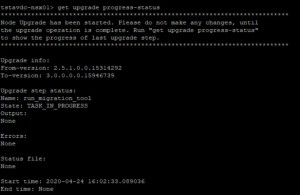
The process takes some time and I was kicked out again.  You can check the status of the update by connecting to a node via SSH and running the following command:

get upgrade progress-status

In the below I connected to the two secondary nodes and got the following:

nsxt-u12


I followed the upgrade process of the node1 and could see the following status

Name: run_migration_tool
State: TASK_IN_PROGRESS

nsxt-u13


At this point I could ping all nodes but was unable to view the gui (or telnet on port 443)

The next stage appeared to be starting the NSX manager service

nsxt-u14

At this point I was able to see port 443 was open on node 1 but not on the others

Extra checks showed the following.(at this point I was still unable to access any GUI)

nsxt-u15

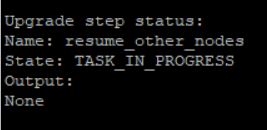
I then logged into other other managers via SSH and could see the start_manager status. Once they were complete i logged back into node1 and could see the next status was restore_datastore_cluster then update_upgrade_status. The final status was Upgrade is not in progress

I then logged into the GUI and could see the following:

nsxt-u16


Great. The upgrade worked. Click around and see the new features and views. To confim the appliances have been updated click system -> appliance

nsxt-u17

The Signature of the OVF Package does Not Match its Content

$
0
0

Issue

I had exported an OVF template from a vsphere 6.0 vCenter and the target woud not accept the OVF unless I edited the XML and removed a specific device (this should be a different post). Thie import worked on vsphere 6.5 and 6.7 but when trying to import into another vsphere 6.0 I got the following error


The signature of the OVF package does not match its content. This indicates theat the package has been tampered with and is a potential security risk

ovf-upload1


Resolution

As I had edited the ovf I needed to recreate the hash and update the the .mf file to reflect this.

To do this I used Powershell

Get-FileHash my.ovf -Alogrithm SHA1

This will output the following

ovf-fail2

You then need to copy the Hash value and edit .mf file (ef my.mf) with an editor (eg Notepadd++)

Replace the current HASH with the new value and save the file

The import should work after that.


Internal Error Occurs During VMware vCenter Server Database Pre-upgrade Check

$
0
0

Problem


When attempting to migrateion from Windows vCenter 6.0 U3 to VCSA 6.7 U3 the pre-upgrade checks failed with

Internal error occurs during VMware vCenter Server Database pre-upgrade check


Migration-assitant.log

Error: Internal error occurs during VMware vCenter Server Database pre-upgrade checks.
Resolution: Please search for these symptoms in the VMware Knowledge Base for any known issues and possible resolutions. If none can be found, collect a support bundle and open a support request.


Upgrade-runner.log

ERROR __main__ Upgrade Phase 'vcdb:CollectRequirements' failed. Exception: [Error 1314] CreateProcessAsUser: 'A required privilege is not held by the client.'
2020-05-20T15:43:45.91Z INFO upgrade.states.component_states vcdb:CollectRequirements: Traceback (most recent call last):


CollectRequirements_com.vmware.vcdb_2020_05_20_16_43.log

ERROR __main__ Upgrade Phase 'vcdb:CollectRequirements' failed. Exception: [Error 1314] CreateProcessAsUser: 'A required privilege is not held by the client.


Resolution

KB2138801 : https://kb.vmware.com/s/article/2148001

Login via an Administrator account on the Windows machine.
1) Go to Control Panel -> Administrative Tools.
2) Open Local Security Policy -> Local Policies. 
3) Under User Rights Assignment -> Replace a Process Level Token.
4) Add service account name that is being used by the vCenter Server service.

Increase iNodes on Netapp FAS

$
0
0

Problem

Our alerting system notified us that inodes were nearing the system limit on a CIFS share (aka unipod_cifs) on a FAS running ONTap 9


Solution

The following command will shiow current usage

syntax

volume show  {cifs_name} -fields files, files-used

command 

volume show unipod_cifs -fields files, files-used


To increase the inodes use the following syntax

volume modify -vserver  {cifs_name}  modify {cifs_name} - files {value}

In this example I will increase the cifs share to 25 million.

volume modify -vserver  unipod_cifs modify unipod_cifs - files 25000000


Script to install Zabbix Agent on CentOS 6 and 7

$
0
0

The following bash script will determine if the guest OS is centos 6 ot 7 then deploy Zabbix Agent version 4.4.x accordingly. Simply change repostories if you want to use a different version:


#!/bin/bash

OUTPUT="$(cat /etc/redhat-release)"
if echo "$OUTPUT" | grep -q "CentOS Linux release 7" ; then
        yes | rpm -Uvh https://repo.zabbix.com/zabbix/4.4/rhel/7/x86_64/zabbix-release-4.4-1.el7.noarch.rpm
        yum -y install zabbix-agent
        cp ./zabbix_agentd.conf /etc/zabbix/zabbix_agentd.conf
        systemctl start zabbix-agent
        systemctl enable zabbix-agent

elif echo "$OUTPUT" | grep -q "CentOS release 6"; then
        yes | rpm -Uvh https://repo.zabbix.com/zabbix/4.4/rhel/6/x86_64/zabbix-release-4.4-1.el6.noarch.rpm
        yum -y install zabbix-agent
        cp ./zabbix_agentd.conf /etc/zabbix/zabbix_agentd.conf
        service zabbix-agent start
        chkconfig zabbix-agent on

else
   echo "OS Not found. Goodbye"
fi


Zabbix Agent Not Starting with Error 1067

$
0
0

Problem

A newly installed zabbix agent (4.4.x) was installed on a Windows 2016 server using an automated script. The error was showing


Windows could not start the Zabbix Agent service on Local Computer

Error 1067: The process terminated unexpectedly

zabbix_agent_fail1


Troubleshooting

i tried to run the command in the foreground 


"C:\Progra~1\Zabbix-Agent\zabbix_agentd.exe" -f --config "C:\Progra~1\Zabbix-Agent\zabbix_agentd.conf"

And it showed the culprit

zabbix_agentd.exe [6964]: cannot open log: unable to open log file [C:\Program Files\Zabbix-Agent\Log\zabbix_agentd.log]: [2] No such file or directory


zabbix_agent_fail2


Resolution

It was simply matter of ensuring the "Log" directory existed and the service started.


Find Temperature of CPU on Cisco s3260

$
0
0

Problem

I got an alert on a Cisco S-Series that CPU #1 and the rear temp was high in Zabbix (over 65c). There were no alerts via the CIMC GUI These temperatures did not match the sensors located in the GUI so i needed to track down where the values were actually coming from.


Solution

SSH to the CIMC named a-chvrepo01.

a-chvrepo01# scope server 1
a-chvrepo01 /server # scope sensor
a-chvrepo01 /server/sensor # show temperature


Output:

Name                          Sensor Status  Reading    Units      Min. Warning Max. Warning Min. Failure Max. Failure
————————-              ————– ———- ———- ———— ———— ———— ————
TEMP_SENS_FRONT        Normal         29.0       C          N/A          60.0         N/A          70.0
TEMP_SENS_REAR          Normal         33.0       C          N/A          80.0         N/A          85.0
P1_TEMP_SENS                Normal         36.5       C          N/A          76.0         N/A          84.0
P2_TEMP_SENS                Normal         36.0       C          N/A          76.0         N/A          84.0

…..

….

Key:

TEMP_SENS_FRONT =      This is the intake temperature sensor. If this is too high, immediately verify that the ambient room temperature is within the desired range.
TEMP_SENS_REAR = This is the exhaust temperature sensor. If this is too high, verify that there are no obstructions to air intake or exhaust, and the air baffles in the server are installed as intended.
P1_TEMP / P2_TEMP = These sensors indicate overheating CPUs


List VLANs and VLAN Groups from Cisco UCS Manager using PowerShell

$
0
0

1) Download and install Cisco UCS Powertool suite (in this example i will be using v2.4.1.3)

2) Install UCS Manager Module

Install-Module -Name Cisco.UCSManager -RequiredVersion 2.4.1.3

3) Start Powertool suite and list modules:

Get-Command -module Cisco.UCSManager | more

4) Connect to the UCS Manager

Connect-Ucs -Name {10.10.10.1}

5) List VLANs and their VLAN Groups 

Get-UcsFabricNetGroup -Ucs {Name_of_UCS} | Get-UcsFabricPooledVlan | Select-Object -Property Name,Dn


Checking the Status of a vSphere Consolidation via CLI

$
0
0

Issue:

To check the status of a snapshot consildation you can use two methods to confirm its progress and whether its still running:


Solution

Interactively check the filestamps on the vmdk files:

SSH to ESXI host and CD into the directory of the VM

watch -d 'ls -luth | grep -E "delta|flat|sesparse"'

Output

Every 2s: ls -luth | grep -E "delta|flat|sesparse"                                                          2021-01-18 09:07:05

-rw-------    1 root     root      185.1G Jan 18 09:06 VMNAME_2-000025-sesparse.vmdk
-rw-------    1 root     root      165.9G Jan 18 08:51 VMNAME_2-000024-sesparse.vmdk
-rw-------    1 root     root      167.2G Jan 18 06:02 VMNAME_2-000023-sesparse.vmdk
-rw-------    1 root     root      173.4G Jan 18 03:07 VMNAME_2-000022-sesparse.vmdk
-rw-------    1 root     root      161.5G Jan 18 00:08 VMNAME_2-000021-sesparse.vmdk
-rw-------    1 root     root      184.2G Jan 17 21:14 VMNAME_2-000020-sesparse.vmdk
-rw-------    1 root     root      177.3G Jan 17 18:06 VMNAME_2-000019-sesparse.vmdk
-rw-------    1 root     root      179.4G Jan 17 15:11 VMNAME_2-000018-sesparse.vmdk
-rw-------    1 root     root      180.6G Jan 17 12:16 VMNAME_2-000017-sesparse.vmdk
-rw-------    1 root     root      176.9G Jan 17 09:15 VMNAME_2-000016-sesparse.vmdk
-rw-------    1 root     root      161.0G Jan 17 06:18 VMNAME_2-000015-sesparse.vmdk
-rw-------    1 root     root      141.5G Jan 17 03:23 VMNAME_2-000014-sesparse.vmdk
-rw-------    1 root     root      229.2G Jan 16 23:55 VMNAME_2-000013-sesparse.vmdk
-rw-------    1 root     root       50.3G Jan 16 19:43 VMNAME_2-000012-sesparse.vmdk
-rw-------    1 root     root      175.3G Jan 16 19:00 VMNAME_2-000011-sesparse.vmdk
-rw-------    1 root     root      160.4G Jan 16 15:53 VMNAME_2-000010-sesparse.vmdk
-rw-------    1 root     root      147.1G Jan 16 13:10 VMNAME_2-000009-sesparse.vmdk
-rw-------    1 root     root      198.3G Jan 16 10:39 VMNAME_2-000008-sesparse.vmdk
-rw-------    1 root     root       27.8G Jan 16 07:12 VMNAME_2-000007-sesparse.vmdk
-rw-------    1 root     root      148.9G Jan 16 06:46 VMNAME_2-000006-sesparse.vmdk
-rw-------    1 root     root      243.2G Jan 16 04:16 VMNAME_2-000005-sesparse.vmdk
-rw-------    1 root     root       31.0G Jan 15 22:25 VMNAME_2-000004-sesparse.vmdk
-rw-------    1 root     root      185.1G Jan 15 21:53 VMNAME_2-000003-sesparse.vmdk
-rw-------    1 root     root      239.6G Jan 15 18:47 VMNAME_2-000002-sesparse.vmdk
-rw-------    1 root     root       37.8G Jan 15 14:25 VMNAME_2-000001-sesparse.vmdk
-rw-------    1 root     root      253.8G Jan 15 13:48 VMNAME_2-000026-sesparse.vmdk
-rw-------    1 root     root       20.0G Jan 15 09:38 VMNAME-flat.vmdk
-rw-------    1 root     root        1.3T Dec 19 18:50 VMNAME_2-flat.vmdk


As you'll see the top file has been touched in the last minute


To delve further and show the status of the task use the following commands:

vim-cmd vimsvc/task_list | grep con

Output

'vim.Task:haTask-15-vim.VirtualMachine.consolidateDisks-168704495'


Use the taskId to show more flags

vim-cmd vimsvc/task_info haTask-15-vim.VirtualMachine.consolidateDisks-168704495


(vim.TaskInfo) {
   key = "haTask-15-vim.VirtualMachine.consolidateDisks-168704495",
   task = 'vim.Task:haTask-15-vim.VirtualMachine.consolidateDisks-168704495',
   description = (vmodl.LocalizableMessage) null,
   name = "vim.VirtualMachine.consolidateDisks",
   descriptionId = "VirtualMachine.consolidateDisks",
   entity = 'vim.VirtualMachine:15',
   entityName = "VMNAME",
   locked = <unset>,
   state = "running",
   cancelled = false,
   cancelable = true,
   error = (vmodl.MethodFault) null,
   result = <unset>,
   progress = 93,
   reason = (vim.TaskReasonUser) {
      userName = "vpxuser"
   },
   queueTime = "2021-01-15T13:47:57.339075Z",
   startTime = "2021-01-15T13:47:57.339263Z",
   completeTime = <unset>,
   eventChainId = 168704495,
   changeTag = <unset>,
   parentTaskKey = <unset>,
   rootTaskKey = <unset>,
   activationId = <unset>
}

As you can see the progress is at 93% and the status is showing as running

Garbage Collection in NetApp Solidfire

$
0
0

Garbage collection on Solidfire starts at the top of every hour:


To run the job manually


https://{mgmt-vip}/json-rpc/5.0?method=StartGC


If you need to run a check on the status of the GC then you can use the following command


https://{mgmt-vip}/json-rpc/5.0?method=GetGCStatus


vCloud Availability – Operation Aborted Due to an Unexpected Error

$
0
0

Problem

A customer deployed the vCloud Availaiblity 4.0 Appliance on site and was able to pair sites. However, as soon as any attempt was made to protect any VM they got an Operation aborted due to an unexpected error message

Resolution

Looking the replicator logs on the we could see the following error messaages

2020-12-16 10:00:49.970 ERROR – [ebed0cb3-39f8-4b84-95cd-cac81759cca1] [pc-host-monitor-5] c.v.h.r.v.m.VimPCEntityRefresher         : Unable to retrieve properties for VC: VlsiSettings [authenticator=co
m.vmware.vlsi.client.vc.SsoVcAuth@72834ede, httpSettings=HttpSettings{version=interface com.vmware.vim.binding.vim.version.version9, proxyProto=’null’, proxyHost=’null’, proxyPort=-1, clientCert=null, t
humbprintVerifier=null, vmodlContext=com.vmware.vim.vmomi.core.types.impl.VmodlContextImpl@1f878eed, resultInterceptor=com.vmware.vlsi.util.ExceptionConverterInterceptor@2b, executorFactory=com.vmware.r
esource.CachedResourceFactory@824e0b3, executorSettings=ExecutorSettings [initialThreads=3, maxThreads=30, keepAliveTime=30, keepAliveUnit=SECONDS], proto=’https’, host=’mycenter.jordansphere.co.ukt’,
port=443, path=’/sdk’, maxConn=10, timeout=30000, trustStore=ClientCertificate{keystorePath=”, keystoreAlias=”}}]

This was implying that the lookup services to the vcenter from the replicator was failing. Despite the GUI showing all statuses as fine (green) we edited the lookup service via the replicator gui and re-applied the settings. The error message disappeared.

HP DL460c Blade Randomly Not Finding SD Card on Reboot

$
0
0

Problem

When we reboot an HP DL460c Gen9 blade approximately 50% of the time it would not find the SD card and thus not boot. 

Resolution

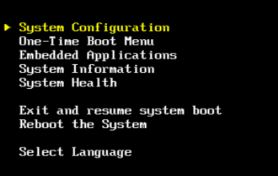
When booting -> Press F9 (System Utilities)

HP-SD1

-> System Configuraion

HP-SD2

-> BIOS/Platform Configuration (RBSU)

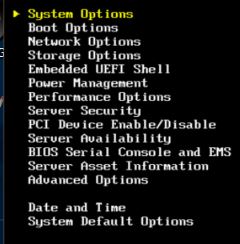
HP-SD3

-> System Options

HP-SD4

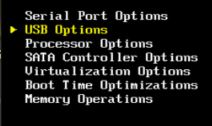
-> USB Options

HP-SD5

-> USB 3.0 Mode. Set to Auto

HP-SD6

ERROR: Update or Delete on Table “cluster_compute_resource_inv” Violates Foreign Key Constraint

$
0
0

Problem


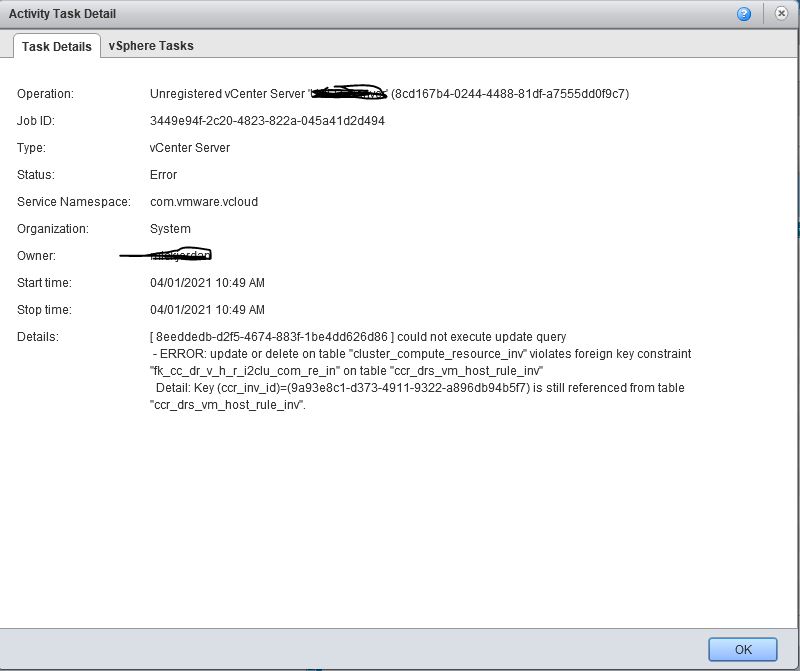
When trying to detach a vCenter from vCloud Director 9.1 – for an upgrade to supported version we got the following error:

[ 8eeddedb-d2f5-4674-883f-1be4dd626d86 ] could not execute update queryERROR: update or delete on table “cluster_compute_resource_inv” violates foreign key constraint “fk_cc_dr_v_h_r_i2clu_com_re_in” on table “ccr_drs_vm_host_rule_inv”
Detail: Key (ccr_inv_id)=(9a93e8c1-d373-4911-9322-a896db94b5f7) is still referenced from table “ccr_drs_vm_host_rule_inv”.

Solution

It appeared that the issues was related to a stale DRS rule in vCenter. I removed the rules and then the vCenter detach was successful.


The Server Does Not Appear to Be Responding. Please Check That Power Is Connected and That the Cisco IMC IP Address Is Correct

$
0
0

Problem:

When logging into the CIMC of the Cisco s3260 I got the following message:

“The server does not appear to be responding. Please check that power is connected and that the Cisco IMC IP address is correct.”

Resolution:


This is known incompatibility bug using the Google Chrome browser. Use an alternative browser and it should work.

SSL VPN Tab Not Displaying when Logged in as Organization Administrator

$
0
0

vCloud version : 10.1.1.16282995

Problem: No organization administrators could view the SSL VPN tab. When logged in as full sysadmin then tab would show. Under permissions of the org administrator role the feature was not visible at all.

Solution: This is not enabled by default. As a sysadmin goto Tenant Access Control -> Rights Bundles -> Edit – Default Rights Bundle” -> Gateway Services -> tick – SSL VPN Configure –> Save

Then go to Global Roles –> Organization Administrator -> Edit -> tick – SSL VPN Configure -> Save


Then publish rights to specified users (or all)

Find Serial Number of Shelf on Ontap v9.x

$
0
0

Problem: I needed to locate the serial number of a new shelf i’d just added.

Solution:

Login to the cluster via SSH and run the following command

my-sannapp01::> storage shelf show

                                                   Module Operational
   Shelf Name Shelf ID Serial Number   Model       Type   Status

          1.0        0 SHFHUaaaaaaaaaa DS212-12    IOM12E Normal
          1.1        1 SHJHUbbbbbbbbbb DS212-12    IOM12  Normal
          1.2        2 SHJHUcccccccccc DS212-12    IOM12  Normal
          1.3        3 SHJHUdddddddddd DS212-12    IOM12  Normal
          1.4        4 SHJHUeeeeeeeeee DS212-12    IOM12  Normal
          1.5        5 SHJHUeeeeeeeeee DS212-12    IOM12  Normal

NSX-T Password Expiry Commands

$
0
0

Useful commands

To reset a root password that has expired (and you still have the admin login)

set user root password “new-pass” old-password “old-pass”

To set the root password to never expire

clear user audit password-expiration

To set no SSH timeout

set cli-timeout 0

Change Default Gateway on NSX-T Manager

$
0
0

I deployed an NSX-T Manager (3.1.0) but the gateway didn’t appear to be set so I couldn’t access it from outside the network

In order to change this

  • Console into the NSX-T Manager that was just deployed
  • Log in using the admin credentials
  • Type
    • set route prefix 0.0.0.0/0 gateway {ip} eth0
    • eg set route predix 0.0.0.0/0 gateway 10.10.10.254 eth0

Viewing all 229 articles
Browse latest View live